My NAS writes its own documentation (and tells me when it's wrong)
I kept a list of every service running on my NAS in a notes file. It had the container names, the ports, the .lan URLs and a few gotchas for each one. The file was written for me, but mostly for the AI agents that help me run the NAS (Claude Code on my Mac and my Hermes agent on the NAS itself), so they wouldn’t have to rediscover everything every time.
On 3 October I compared that list with what was actually running. It was wrong in both directions. It was missing my webmail stack (four containers) and my task manager, Vikunja. It still listed tldraw, an n8n bridge, two Cloudflare tunnels and Nginx Proxy Manager, none of which were running anymore. Nobody had noticed, because nothing ever checked.
The problem wasn’t one list. The facts about my services live in at least six places: compose files in three different folders (my own, Dockhand’s and the UGOS app store’s), the Caddyfile, AdGuard on the router, Uptime Kuma’s database and the Homepage dashboard config. Any list I keep by hand is a copy of those, and a copy goes stale.
In this post, I will show you how my NAS now writes its own documentation every night from those live sources, and how it tells me on Telegram when two of them disagree.
The idea: two files per service
There are multiple ways to document a home lab. I could’ve used a wiki and promised myself to keep it updated, but that’s exactly what failed. What I really wanted was this: everything a script can read from the system gets generated, and only what a script can’t know gets written by hand.
So every Docker Compose stack gets two Markdown files, side by side in one git repo:
services/vikunja.mdis hand-written: why the service exists, how to operate and restore it, gotchas, and where its secrets live (never their values).services/vikunja.gen.mdis generated: containers, images, status, ports, URLs, mounts, backup status, Uptime Kuma monitors and the names of the variables in its env files.
On top of those, a generated INDEX.md lists every stack with its purpose, URL and status, followed by two lists: Drift (something is wrong) and Coverage (a stack with no hand-written notes yet).
The script that builds all this is a single Python file, docs_gen.py, about 1,100 lines, using only the standard library plus PyYAML (both were already on the NAS, so there was nothing to install). I built it together with Claude Code in one evening: I described what I wanted and made the calls, and Claude wrote most of the Python.
This is how the generated page for Vikunja looks:
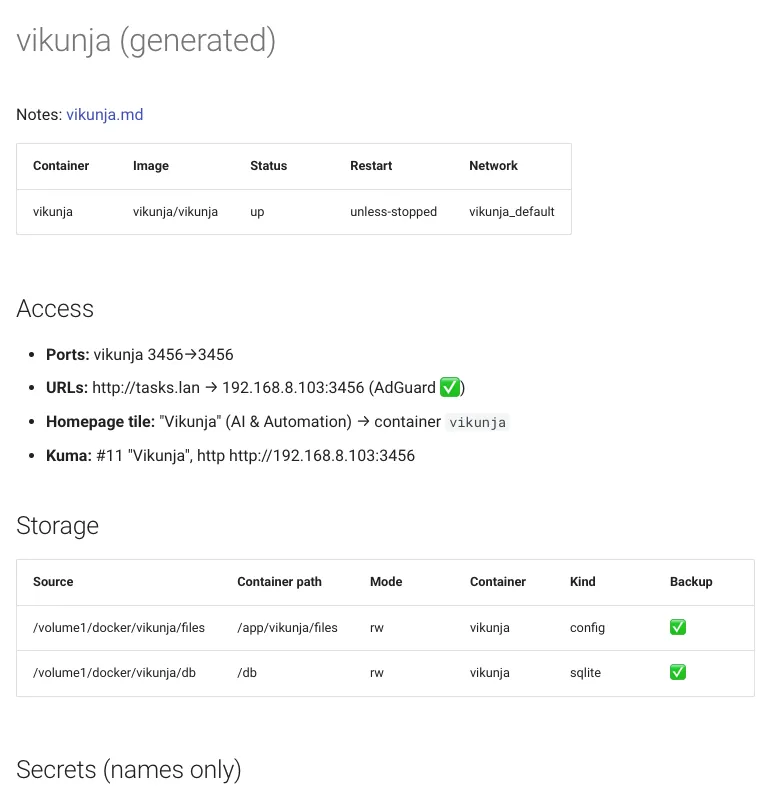
Every line on that page comes from a live source. The port from Docker, the URL from the Caddyfile, the ✅ next to it from AdGuard, the tile from Homepage, the monitor from Uptime Kuma’s database, and the Backup column from the include list of my nightly backup.
1. Collect the facts from the live system
The first part of the script reads every source into one big dictionary of plain data. It runs on the NAS itself, as my user, because that’s where the facts are: Docker, the compose files, the Caddyfile and Kuma’s SQLite database are all local, and the router is one SSH hop away. Running it from my Mac would’ve made it depend on my Mac being awake.
The sources are:
docker inspecton every container: image, state, health, restart policy, networks, ports, mounts and the Compose labels (which tell me the project name and where its compose file lives).- The compose files, but only to find the env files. From those I keep variable names only, never values.
- The Caddyfile, parsed for site names and their
reverse_proxyupstreams. - Uptime Kuma’s
kuma.db, opened read-only. - Homepage’s
services.yaml. - My nightly backup’s include list.
- Over SSH on the router: AdGuard’s DNS rewrites,
tailscale dns status,tailscale status --jsonand the advertised routes.
One decision I’m happy with: every source fails on its own. If the router doesn’t answer, the run continues, the router fields say unknown (source unavailable), and the router’s page keeps its last good content instead of going blank. Here’s the small wrapper that does it:
def source(name, fn, *args):
    try:
        value = fn(*args)
        facts["sources"][name] = {"ok": True}
        return value
    except Exception as e:  # each source fails on its own
        facts["sources"][name] = {"ok": False, "error": f"{type(e).__name__}: {e}"[:300]}
        return None
The only exception is Docker. If Docker doesn’t answer, there’s nothing to document, so the run stops without writing anything (and that silence raises its own alert, more on that below).
The collected facts can also be saved to a JSON file with docs-gen --dump-facts. This turned out to be very handy for testing, as you’ll see later.
2. Turn the facts into pages, and look for drift
The second part takes the facts plus my hand-written notes and produces every generated file. It doesn’t touch the disk or the network, so the same input always gives the same output.
This is also where it checks the sources against each other. That’s the part I find the most useful, much more than the tables. A few examples of what counts as drift:
- An AdGuard
.lanrewrite with no Caddy block, or a Caddy site with no AdGuard rewrite. - An Uptime Kuma monitor probing a port that nothing on the NAS serves.
- A Kuma monitor probing a port that belongs to a different stack than its name says. That monitor is green, but for the wrong reason.
- A Homepage tile pointing at a container that doesn’t exist.
- A mount that holds state (a SQLite database, config, secrets) that my nightly backup doesn’t cover.
- A hand-written note for a stack that isn’t running anymore.
- Tailscale’s Split DNS for
.lannot pointing at my NAS’s DNS forwarder, or a route the router advertises that isn’t approved.
Each drift item gets a stable key, like adguard-no-caddy:npm.lan or kuma-port-orphan:8. That way, the script can compare tonight’s list with last night’s and tell what’s new. It reads last night’s list from the committed INDEX.md, so there’s no extra state file to keep.
A stack with no Kuma monitor is not drift, and neither is a stopped container. I decided against flagging those because they would have filled the list from day one, and a list that’s always full is a list I stop reading.
3. Never overwrite what I wrote by hand
A script that writes into the same folder as my notes makes me nervous. So it has three separate guards:
- It only writes
INDEX.md,services/*.gen.mdandinfra/*.gen.md. Any other path raises an error. - It never overwrites a file that doesn’t start with its own header comment, so a
.gen.mdI made by hand is left alone (and flagged as drift). - It commits with an explicit list of paths, so even a bug can’t sneak another file into the commit.
The header is a plain HTML comment right after the front matter:
---
stack: vikunja
compose: /volume1/docker/vikunja/docker-compose.yaml
images: ["vikunja/vikunja"]
generated: 2026-10-07T04:30:03+03:00
---
<!-- GENERATED by docs-gen. Do not edit; hand notes go in vikunja.md -->
It goes after the front matter for a reason: MkDocs only hides front matter when it’s the very first thing in the file. In my first version, the header came first, and every generated page showed its front matter as a heading.
One more small thing: the generated: date only changes when the content of the file changes. Without that, every run would commit every file, and git log would be useless. Now the docs repo history shows exactly when something changed, and git log --author=docs-gen is the history of my drift.
4. Run it every night and alert on new problems
On my UGREEN NAS, crontab isn’t really an option for my user, so the script runs from a systemd user timer every night at 04:30 (I explained why in my UGREEN cron jobs guide):
[Unit]
Description=Daily 04:30 run of docs-gen

[Timer]
OnCalendar=*-*-* 04:30:00
# If the NAS was off at 04:30, run on next boot.
Persistent=true

[Install]
WantedBy=timers.target
The timer calls a tiny wrapper installed as ~/.local/bin/docs-gen. It uses flock, so a nightly run and one I start by hand can never overlap:
#!/bin/sh
exec /usr/bin/flock -w 600 /tmp/docs-gen.lock /usr/bin/python3 /volume1/docker/docs/tools/docs_gen.py \
    --repo /volume1/docker/docs "$@"
I can also run it on demand from my Mac with ssh nas docs-gen, or ssh nas docs-gen --dry-run to see the drift and the diff without writing anything.
For the alerts, I didn’t build anything new. I already use Uptime Kuma push monitors for every scheduled job on the NAS, and they all alert through the Telegram bot of my Hermes agent. So docs-gen got its own push monitor, “docs-gen (nightly)”, and at the end of each run it pushes:
upwith a message like0 drift, when there’s nothing new;downwith the new keys, when the drift list gained something since last night. Kuma sends me one Telegram message, and the next clean run turns the monitor green again;- nothing at all when the run didn’t happen. After 26 hours of silence, Kuma alerts anyway.
if result["new"] or pushed_after is False:
    heartbeat(kuma, False, "new: " + ", ".join(bad))
else:
    heartbeat(kuma, True, f"{n} drift")
Only new items alert. The drift I already know about stays visible in the INDEX, but it doesn’t wake me up every night. The alternatives would’ve been a task in Vikunja for every item (they’d duplicate the INDEX and go stale too) or having the script message Hermes directly (it would need the bot token). Reusing Kuma meant one secret less.
The last step of each run pushes the docs repo to a private GitHub repo, so I have an off-site copy. If that push fails, it’s drift too.
5. A page to read it: MkDocs at docs.lan
My first plan was to read the docs only by asking Hermes on Telegram (“what port is Vikunja on?”). Hermes has the repo mounted read-only, so it always answers from the current version. That works, but the day after, I wanted a proper page I could browse from my phone too.
So I added one more small stack: MkDocs Material, serving the docs folder read-only.
services:
  docs-site:
    image: squidfunk/mkdocs-material
    container_name: docs-site
    command: serve --dev-addr 0.0.0.0:8000 --livereload
    ports:
      - 8094:8000
    volumes:
      - ./mkdocs.yml:/docs/mkdocs.yml:ro
      - /volume1/docker/docs:/docs/wiki:ro
    restart: unless-stopped
I run mkdocs serve instead of building static files, so a docs-gen run or a push from my Mac shows up within seconds, without a build step. That’s the development server, which is fine for a read-only page on my LAN and tailnet. I wouldn’t use it for anything public.
In Caddy, docs.lan sends the home page straight to the INDEX:
http://docs.lan {
	redir / /INDEX/
	reverse_proxy 192.168.8.103:8094
}
It should look like this (I’ve hidden three rows for private projects, which is why the counter says 18 stacks):
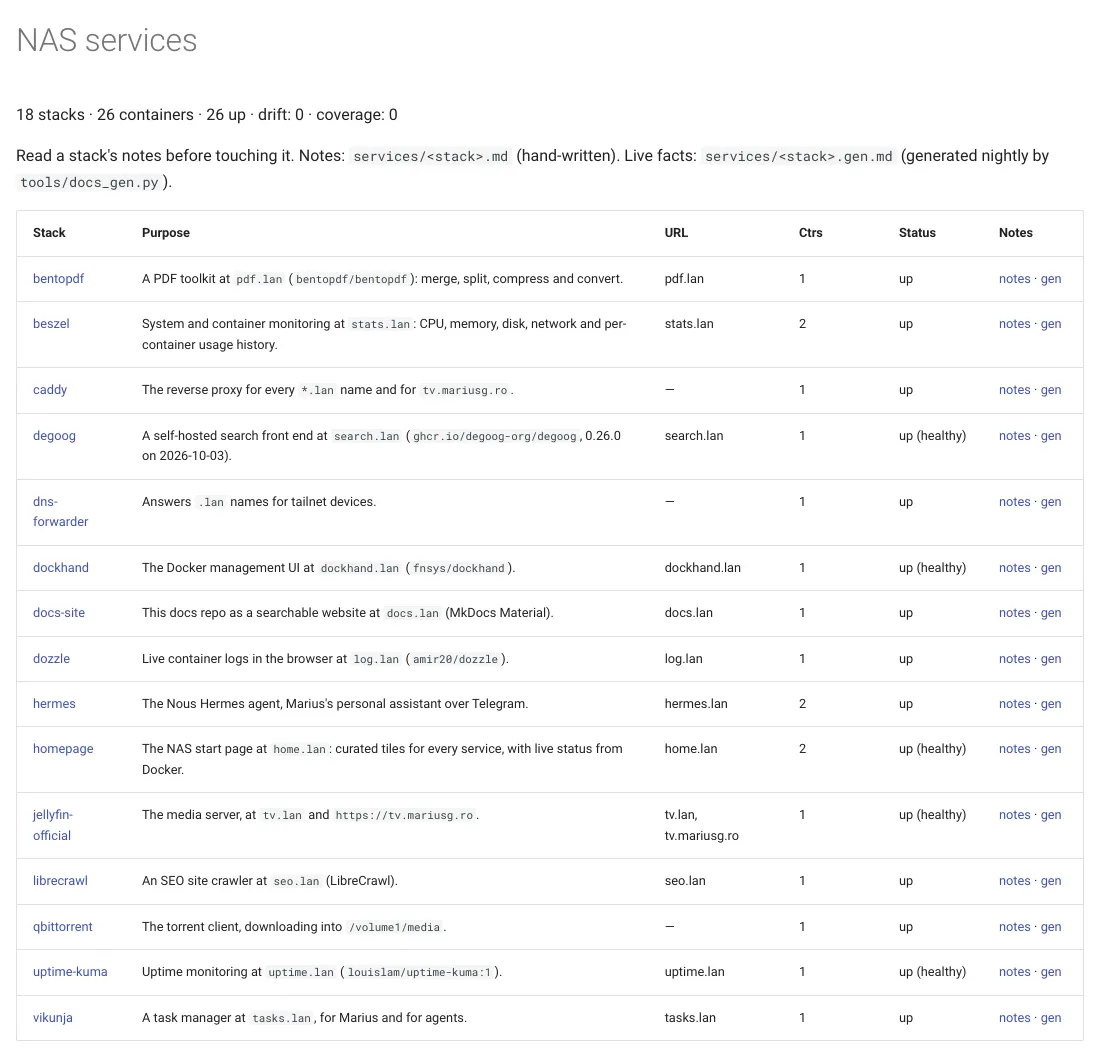
The navigation comes from the folder layout, so a new note shows up on its own. And since it’s reachable over Tailscale, I can open it from anywhere.
Testing it
I’d never trust a script that commits to a repo every night without testing it first. The --dump-facts option made that easy: I saved a snapshot of the real facts once, and the tests run the whole CLI on that snapshot, in throwaway git repos. They check the generated files against “golden” copies, and they check the guards: that a hand-made file in the generated namespace is never overwritten, that a failed source keeps the last good page, and so on. I ran them again while writing this post:
Ran 33 tests in 27.791s

OK
When a parser breaks on something real (for example, a new kind of line in tailscale dns status), I capture the input with --dump-facts and add it as a new test case.
The other test is the dry run. Funnily enough, when I ran docs-gen --dry-run for this post, it had something new to say: a test WordPress stack I had started a few minutes earlier:
drift (2):
  NEW unbacked-state:tp-prefix-test:tp-prefix-test_wp  `tp-prefix-test` keeps config state in volume `tp-prefix-test_wp` (tp-prefix-test-wordpress-1:/var/www/html), which the nightly backup doesn't cover; back it up or mark it `backup: skip`
  ...
coverage (1):
  NEW no-notes:tp-prefix-test
That’s exactly what I’d want it to say about a throwaway stack: it has no notes, and its data isn’t backed up.
What it caught on the first night
The first real run was on 3 October, at 20:59. It found 8 drift items in a NAS I thought I knew well:
npm.lanstill resolved in AdGuard, but Nginx Proxy Manager was long gone (Caddy replaced it).- Kuma monitor #8 “tldraw” was probing a port nothing served anymore.
- Kuma monitor #11 “n8n Bridge” was green, but the n8n bridge was removed. Vikunja had taken over its port, 3456, so the monitor was really watching Vikunja. I renamed it, and that’s why you see
#11 "Vikunja"in the screenshot above. - Three Homepage tiles pointed at containers that didn’t exist.
- My router was advertising itself as a Tailscale exit node (
0.0.0.0/0), which I never asked for. It turned out GL.iNet’s startup script forces that flag on every start, whatever the setting says. - One app kept a SQLite folder that my nightly backup didn’t cover.
Once I added the notes, two more turned up. For example, Kuma monitor #9 was probing the Hermes dashboard on the NAS’s LAN IP, but the dashboard only listens on 127.0.0.1. The Telegram alert for those two read:
new: kuma-port-orphan:9, tailscale-routes-mismatchBy 22:38 the same evening, the drift list was at zero, and 14 minutes later I had written notes for the remaining 8 stacks, so coverage was at zero too.
Since then, it has alerted twice more:
- 6 October, 04:30: the router didn’t answer over SSH (“No route to host”) and the push to GitHub failed, in the same run. The NAS itself was down at that moment (I think it was installing an update), so this one was a false alarm about the docs, but a real one about the NAS.
- 11 October: no run at all. The NAS had rebooted, and on UGOS a reboot can leave every systemd user timer dead. The missing heartbeat is how I found out (I wrote about that morning in the Uptime Kuma post).
Most nights, though, the only thing it does is commit a small change, like a Tailscale device’s “last seen” date, and push 0 drift.
That’s it! My NAS now documents itself every night, and the docs can’t quietly drift from what’s really running, because the drift is the first thing they report.
Closing remarks
- The hand-written half still needs me. The script can tell me that a stack has no notes, but it can’t write why I installed it. When I add a service with Claude Code, the last step of that workflow is writing the note while the context is still fresh. A note with a
reviewed:date older than 180 days shows “review due” in the INDEX, but it never alerts. That’s a nudge, not an alarm. - It’s built for my NAS. The paths, the router, the Dockhand path rewrite and the UGOS quirks are all hard-coded. The idea carries over to any Docker host, but the script won’t run on yours as-is. That’s also why I’m not sharing the full script: you’d end up rewriting most of it. The parts worth copying are the ideas above (one facts snapshot, stable drift keys, alert only on new keys, never touch hand-written files), and they’re small enough to build around your own sources.
- Secrets stay out by design. The docs hold variable names and where a secret lives, never the value. That’s also why I’m comfortable letting Hermes read the whole repo.
- The docs are now the first thing my AI agents read. My agents’ instruction file shrank from 132 lines to about 45: how to connect, a few gotchas that apply everywhere, and “read
docs/INDEX.mdbefore touching a service”.
If you document your home lab in a different way, or you have an idea for another drift check, let me know.