I built one dashboard for my iOS app's App Store sales, web funnels, Stripe and Meta ads
We have a subscription iOS app that sells in two ways. Inside the app, people start a trial or subscribe through the App Store (we use Adapty for the paywall and the entitlements). Outside the app, people come from Meta ads to a quiz funnel on the web and pay with Stripe, then download the app and sign in.
Both ways work, which is good. The problem was answering simple questions about our customers. Who is paying right now? Who renews next week, and for how much? Which ad brought this person in? Did they even open the app after paying? To answer any of these, I had to open six tabs: Stripe, Adapty, Firebase, GA4, Meta Ads Manager and the WordPress database behind the quiz. None of them knows the whole customer. Stripe knows the payment but not whether the app is used. Adapty knows the App Store side but not that a web subscription was cancelled. Meta knows the click but not the renewal.
In this post, I will show you how I put all of it into one self-hosted dashboard that runs in Docker on my NAS, and what it showed me that the six tabs never did.
A note before we start: I can’t share the app’s name or its numbers yet. So there are no real customer counts, prices or revenue in this post, and the screenshots use made-up data. The setup is the interesting part anyway, and it works for any subscription app that sells both in the App Store and on the web.
Why I didn’t use Looker Studio (or a SaaS tool)
When the app launched in July, the open question was where the numbers should live: GA4 explorations, or a Looker Studio report on the BigQuery export. Both cover events, but not customers. The GA4 Data API has no per-user dimension, so anything per customer has to come from BigQuery. And Stripe and Adapty aren’t in BigQuery at all. I’d have to get them there first, and by that point I would’ve built most of a custom tool anyway, just with a report on top that I can’t add an alert to.
What about Adapty’s own analytics? We already use Adapty, so it was the obvious candidate, but I don’t really like it. It only sees what goes through Adapty, and not all our sales do: some of the Stripe sales from the web funnel show up there with $0 revenue. And I wanted one place for everything, not just subscriptions: the ads, the funnels, the app usage and the emails, next to each customer.
So I decided to build a small app instead: a Python sync worker that reads every source into SQLite, and a FastAPI page that shows it. I built it together with Claude Code, starting at the end of September: I described what I wanted and made the calls, and Claude wrote the code. Six weeks later it has 87 tickets behind it, about 12,000 lines of Python and 432 tests.
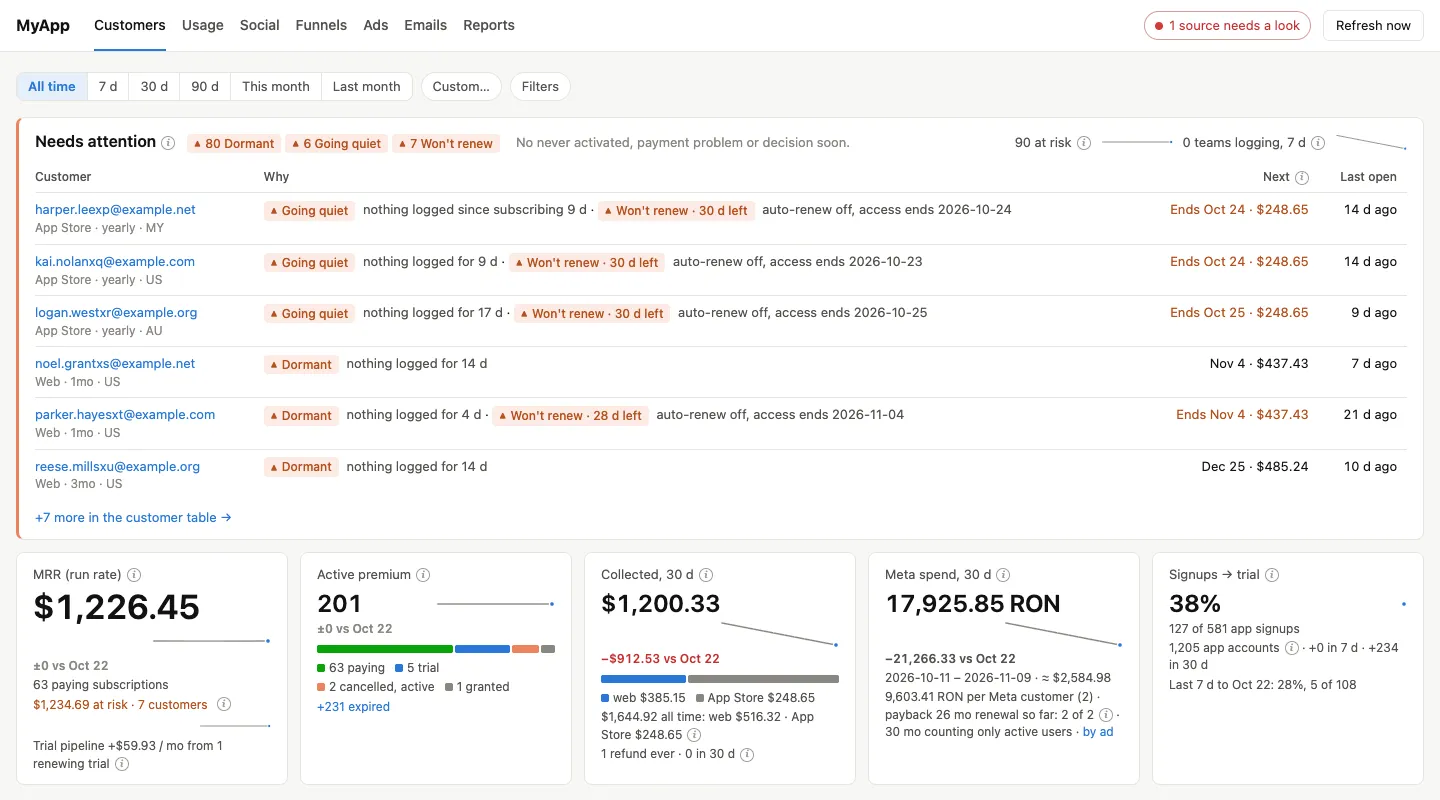
This is how the main page looks (with made-up data, as promised):
1. One container, and the page never calls an API
Here’s the whole stack:
- One Python 3.12 container on the NAS.
- A sync worker that reads the sources and writes to SQLite.
- A FastAPI app with Jinja templates that reads only from SQLite. It never calls an external API, so a page load is fast, and a slow or broken source can never break the page.
- Charts are SVG drawn by the templates. There’s no chart library and no JavaScript build step.
The dependencies are short: FastAPI, Uvicorn, httpx, google-auth, Jinja2, PyYAML and pycountry, plus Pillow for post thumbnails.
One decision I’d make again: the scheduler runs inside the container, not in systemd timers on the NAS. My NAS user timers used to die after every reboot (the /home folder mounts late), and I didn’t want the dashboard to depend on that. A thread in the container wakes up every minute and decides what’s due. The schedule is in config.yaml:
schedule:
  timezone: "Europe/Bucharest"
  daily_sync_at: "04:30"
  stripe_poll_minutes: 5
  adapty_check_minutes: 60
And because it runs in Docker, it’s tracked by Uptime Kuma like the rest of my home lab. After each good daily sync, and after each good Stripe poll, the container sends a push to Uptime Kuma. If the daily sync doesn’t report for 26 hours, or the Stripe poll for 30 minutes, I get a Telegram message. I wrote about how these push monitors work in Uptime Kuma push monitors for cron jobs.
2. Read every source, then join them by email
These are the sources and what the dashboard reads from each:
| Source | What we read |
|---|---|
| Stripe | customers, subscriptions, invoices, refunds, and the events feed |
| Adapty | each user’s premium access level: active, trial, renews or not, billing issue |
| Firebase Auth | every app account: email, created, last sign-in |
| Firestore | when each user last logged something in the app (timestamps and counts only) |
| BigQuery (GA4 app export) | app opens and sessions per user |
| WordPress (the quiz) | the funnel session behind each web purchase: first-touch UTMs, the ad’s click id |
| Meta Marketing API | spend, clicks and results per ad per day |
| GA4 (web property) | the visitor’s country, email clicks |
| Resend | the lifecycle emails and what happened to them |
The glue is the email. The app identifies users in Adapty by their account email, the web checkout asks for an email, and Firebase has one per account. So a customer is any Stripe subscription or any Adapty profile with a premium access level, past or present, matched to an app account by email. I compare emails in lowercase but keep the original value. A customer with no app account isn’t dropped. They show as unmatched, because a web buyer who never signed in to the app is exactly the person I need to see.
For the web purchases, there’s a second key. The quiz writes a funnel_session_id into the Stripe subscription’s metadata, and the same id is on the quiz submission in WordPress. That’s how each web customer gets their campaign, their ad and their quiz answers.
There’s one trap I want to point out. Adapty doesn’t know that a web subscription was cancelled. When someone pays on the web, the access is granted in Adapty until the end of the paid period, so Adapty shows them as active either way. Whether they’ll renew comes only from Stripe’s cancel_at_period_end. If you read only one source, you’ll get the wrong answer for some customers without noticing.
3. Read-only, always
This is the part I’m most careful about, and I’d recommend it to anyone building something similar. Most of these API keys can do a lot more than read:
- The Stripe key is a full live secret key.
- The Adapty key can grant and revoke subscriptions.
- Resend has no read-only key at all, only full access.
So the rule is simple: the dashboard only makes GET and list calls, plus SELECT queries in BigQuery and a few fixed read-only SELECTs on the WordPress database. Nothing ever writes to a source.
The second rule is about the users’ data. The app stores personal data that people trust us with, and the dashboard doesn’t need any of it. It reads counts and timestamps only (when they last logged something, how many days they were active), never the content. One thing surprised me here: the Firebase Auth call that returns all accounts also returns each user’s passwordHash in the same response. The sync drops it before anything is saved, and there’s a test that checks it.
4. Fresh data without webhooks
The NAS isn’t reachable from the internet, so Stripe webhooks were out. I could’ve exposed an endpoint just for them, but I prefer to keep the NAS closed and poll instead:
- Every 5 minutes, read Stripe’s
/v1/events. If a new subscription or invoice event appears, run a full sync right away. In practice, a web sale is on the dashboard within a few minutes. - Every hour, check Adapty for every app account. This catches App Store trials and purchases, which Stripe never sees.
- Every day at 04:30, a full sync of everything, as the safety net. It also saves a daily snapshot of the key numbers, which is where the trend lines come from.
- A Refresh now button for when I can’t wait.
The other pages (ads, funnels, app usage, emails) have their own hourly reads, each with its own lock. A failure in one of them never fails the daily sync, so a hiccup at Meta doesn’t make Uptime Kuma think the whole thing is down.
5. Money: be strict about what MRR means
I wanted one MRR number I could trust, so I wrote down exactly what it means before writing any code:
- MRR (run rate) is the next charge at the regular price, divided by the plan’s length in months, summed over the paying subscriptions that will renew.
- Trial pipeline is the same calculation for trials.
- Collected revenue is the exact money received: Stripe’s paid invoices minus refunds, plus Adapty’s revenue for the App Store.
The “regular price” part matters for us. Our web plans have an intro price on the first period (a Stripe coupon with duration: once). If the dashboard used the current price, a customer who just paid the intro price would add a fraction of their real MRR. So the run rate applies only the discounts that last forever:
def plan_months(interval, count):
    n = count or 1
    return {"month": n, "year": 12 * n, "week": n * 12 / 52, "day": n * 12 / 365}.get(interval)

next_charge = apply_discounts(price, discounts)                 # what Stripe charges next
run_rate = apply_discounts(price, discounts, {"forever"}) / months  # what it's worth per month
Another small one: Adapty profiles and products don’t carry the price. So the App Store prices live in config.yaml, copied from App Store Connect, keyed by the product id.
The last money lesson came later. The dashboard shows a payback per ad (spend divided by the MRR it brought). That number quietly assumes everyone keeps paying, and our first customers hadn’t reached a renewal yet. So every payback now says “if all renew” next to it, and once renewals happen, it says how many did (“renewal so far: N of M”). Beside it, there’s a second payback counting only customers who still use the app. It’s a less exciting number, but it’s the honest one.
6. Flags that tell me who needs attention
The page I open most is not a chart. It’s a list called Needs attention. Every customer gets flags, with thresholds in config.yaml:
- 🔴 Never activated: a web buyer, more than 24 hours after paying, with no app account or no app open.
- 🔴 Payment problem: past due in Stripe, or a billing issue or grace period in Adapty.
- 🟠 Going quiet: nothing logged in the app for 3 days. Dormant at 7.
- 🟠 Won’t renew: auto-renew is off, access is still active (days left shown).
- 🟡 Decision soon: a trial ends, or the first full-price charge after the intro price comes, within 3 days.
The list is sorted by colour, then by the soonest charge, then by the amount. So the top row is always the customer with the most money at stake soonest. Each customer page also has a small follow-up note: when we contacted them, one line of text, and a “snooze until” date. It’s the only thing the dashboard writes, and it never leaves the NAS.
The red flags also come to me as a Telegram message right after the sync that finds them (through the same bot my Hermes agent uses), and every Monday at 09:00 there’s a digest with the week’s numbers.
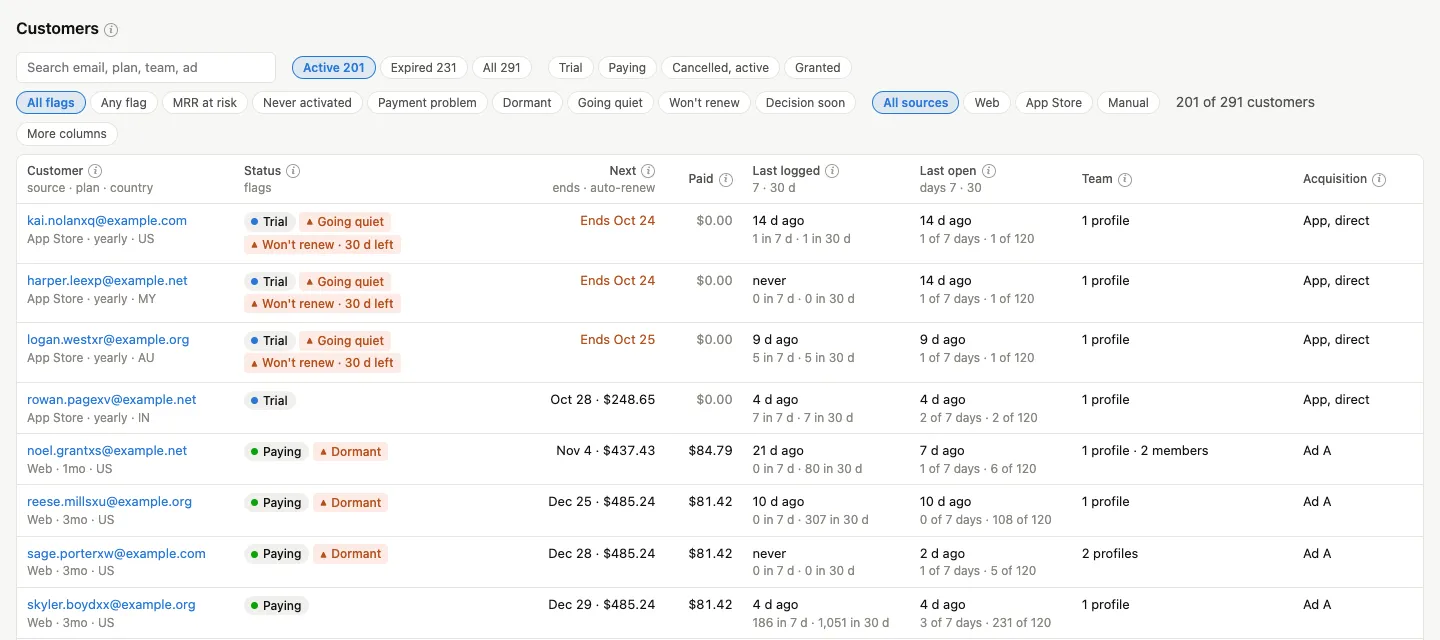
The same flags show in the customer table, next to the next charge, what they paid, when they last logged something and opened the app, and where they came from:
7. Web funnels and ads: count only the real traffic
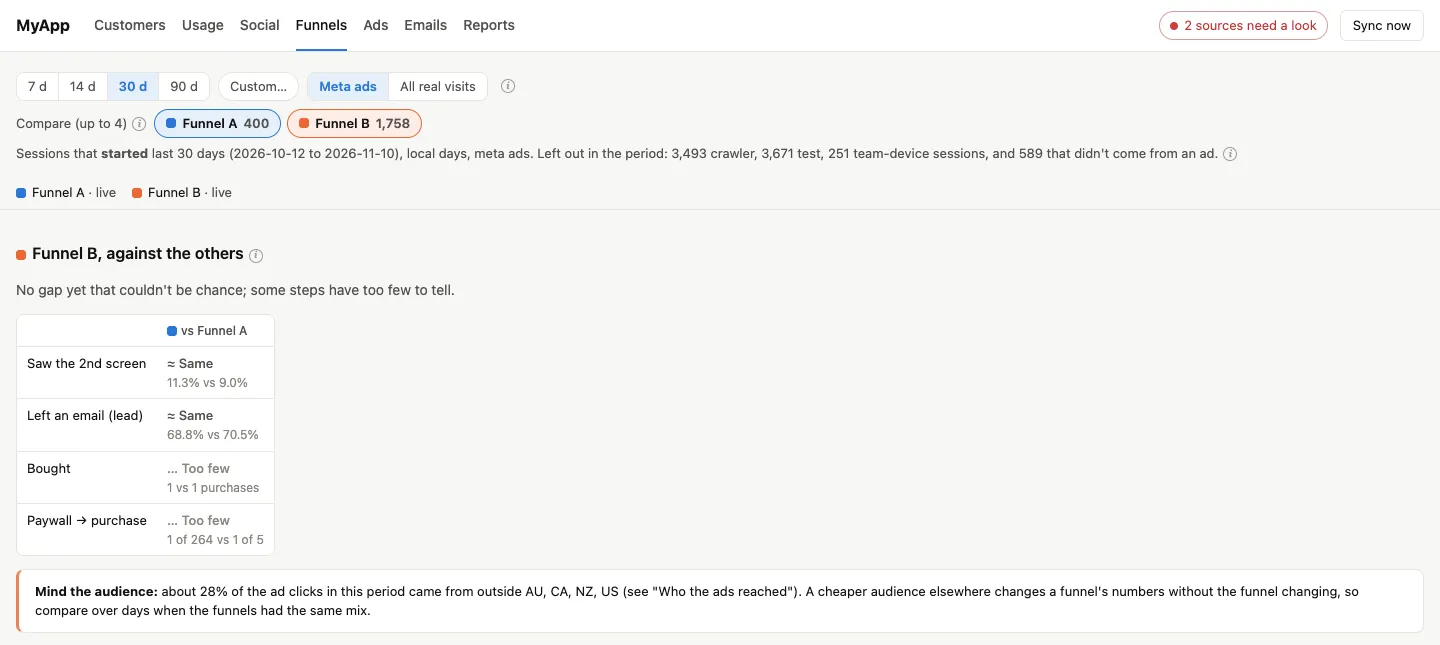
The funnels page compares our quiz funnels on the same traffic, and the ads page puts Meta’s numbers next to ours, per campaign, ad set and ad. To make both trustworthy, the first job was deciding what counts as a real ad visit. It took longer than I thought.
A real ad session is a paid UTM with a Meta click id. These are always left out:
- Our own tests: the QA sources, the staging domain, and the URL flags our checks use.
- The team’s devices: anyone with 10+ sessions across 3+ funnels.
- Meta’s ad-review crawler. When an ad goes live or changes, Meta visits the landing page several times within a few minutes, and those visits look like real clicks that left on the first screen. The rule: 6 or more first-screen-only ad sessions within 15 minutes are the crawler. Checked against a list made by hand from Meta’s activity log, it missed nothing.
There was also a subtle one with returning visitors. The quiz remembers answers in the browser, so a person who comes back from a second ad click resumes where they left off. Counting that as a new ad session that “reached the second screen” made some ads look better than they were. Now a resumed session folds into the one it continues.
For the comparison itself, I didn’t want a dashboard that says “funnel B wins” after 30 visits. The verdict uses Wilson intervals and Fisher’s exact test, says “higher” or “lower” only at p < 0.05, and says “too few to tell” when there are fewer than 20 sessions a side. It says that a lot, and that’s fine.
The alert I like most here is spend without results: a web campaign or ad that spent more than a set amount over the last 2 full days with no real quiz session (🔴, the link or the quiz is broken) or with sessions but no lead (🟠). Before turning it on, I replayed it over the previous 30 days. It found two real problems and raised no false alarms.
It should look like this:
8. What it showed me that the six tabs didn’t
Here’s the part that made the whole thing worth it. Two days after the first version, I looked at why App Store trials weren’t converting.
- Most of the trials cancelled on day 0 were cancelled within 10 minutes of starting, with barely any use of the app. That’s not a product problem. It points at the paywall, the price, or people who never meant to pay.
- Some of the trials that “didn’t convert” didn’t cancel at all. The first charge failed. And those were the most engaged trials we had. Apple retries the charge, so these people are worth a reminder, not a write-off. In Adapty, the cancellation reason for them is
billing_error, but you only notice when it sits next to their usage.
Neither of those is visible in Stripe, Adapty or GA4 alone. You need the trial, the cancel time and the app usage on the same row.
9. Making it readable for other people
Two people I work with on the app use the dashboard too, and that changed how it’s built.
- An ⓘ on every metric. Each tile, chart and column header explains what it counts, from where, and what it leaves out, in plain words. A test checks that every tile has one.
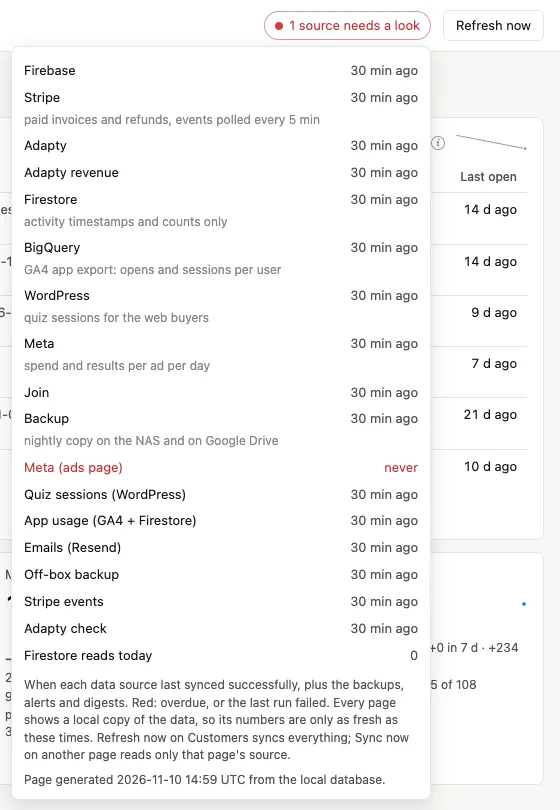
- A redesign after a month. The pages had grown in the order the tickets shipped, not in the order anyone reads them. The customer table, the reason the page exists, started about 4,300 pixels down. The redesign put it near the top, cut the customer table from 19 columns to 8, and replaced a strip of 15 “source: 2 h ago” items with one health pill that says either “all fresh” or how many problems there are.
- Access from outside. On my LAN it’s a
.lanname through Caddy. From outside, it’s behind a Cloudflare Tunnel and Cloudflare Access, with a one-time PIN for a short list of named emails. There’s no public route to it at all.
This is the health pill opened. Every source with its last good sync, and the one that needs a look in red:
10. Two home-lab surprises
Docker started the container without a network. After a NAS reboot in October, the dashboard ran for two and a half days without being able to resolve a single hostname. It wrote its sync runs, and every one failed. The NAS’s DNS was fine, and other containers resolved. Docker had restarted this container (and one other) without joining it to its network, so its own resolver never answered. The fix is in the container now: after 30 minutes without DNS, it exits on purpose, and Docker starts it again with a fresh network join.
The dashboard was eating the app’s free Firestore reads. Firestore bills every document read, and the free tier is shared with the app itself. Reading every activity on every sync was fine at launch, but it grows with the users. So each run now logs the reads it was billed for, the health pill turns red past a daily limit, and the reads became incremental: only users who logged something recently, with a full read on Sundays to catch deletions. The daily run went from thousands of reads to about a hundred, and the numbers it produces matched the full read row for row.
That’s it!
You now have the full picture of how a subscription app that sells in the App Store and on the web can see each customer on one page: a sync worker into SQLite, a page that only reads SQLite, read-only keys, polling instead of webhooks, strict money definitions and flags that tell you who to look at.
Closing remarks
- This is not a product, and it’s not small. It’s a custom app with its own tests, backups (every night to the NAS and to Google Drive) and monitoring. If one SaaS tool covered your setup, I’d use that first.
- The payback and the retention numbers are still young. Most customers haven’t reached a renewal yet, so the dashboard says so instead of guessing.
- I can’t link a repo this time. The code isn’t a secret, but it’s built around our app, and its name is everywhere in it. Everything you need to build something similar (the stack, the sources, the rules) is in this post.